


Back in December 2021, with the Federal Reserve preparing to reverse some of the $4.5 trillion of pandemic-era liquidity injections, we predicted: “the broad investment environment will likely become more complex in 2022” (2021 Review and 2022 Outlook: Volatility Returns, 12/24/21).
Well, our forecast turned out to be a major understatement; volatility ratcheted up as soon as the calendar flipped, shifting into higher gear once Putin invaded Ukraine and inflation ripped higher. It’s resulted in 6 months of widespread portfolio pain, with essentially no place to hide (see below the YTD returns on various asset classes).
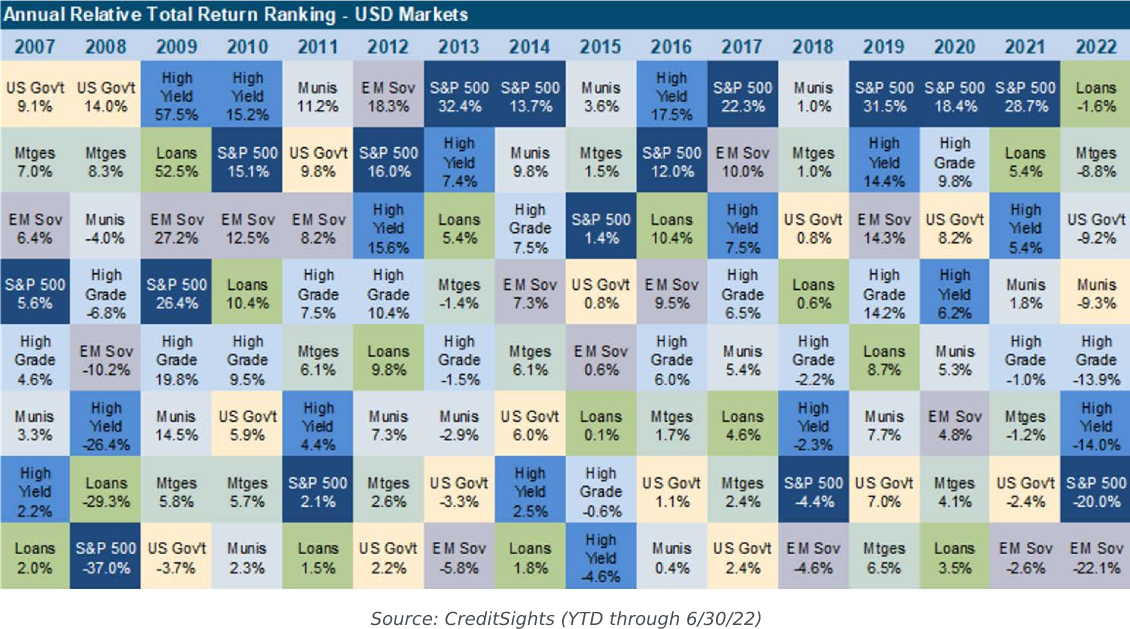
Other than the depths of 2008’s Great Financial Crisis and March/April 2020’s Covid selloff, it’s been a long time since we’ve experienced such a violent market reaction. The S&P 500’s -20.0% YTD price return ranks as one of the worst starts to a year since the Great Depression, while the Nasdaq‘s -29.2% first-half price return is reminiscent of its losses when the 2000-2001 Tech Bubble burst. Even the classic 60% stocks/40% bonds portfolio, designed to dampen volatility by combining two asset classes that typically move in opposite directions, hasn’t been spared: it’s -16.1% YTD performance is worse than all but one of the past 30 full-year returns.
Both macro and micro-investment conditions are significantly more challenging:
• The knock-on effects from the Ukraine war, along with lingering distortions from oversized Covid related fiscal and monetary stimulus, have driven inflation to unacceptably high levels. Shortages in key goods and commodities, particularly energy and agricultural products, have had particularly damaging and pervasive impacts
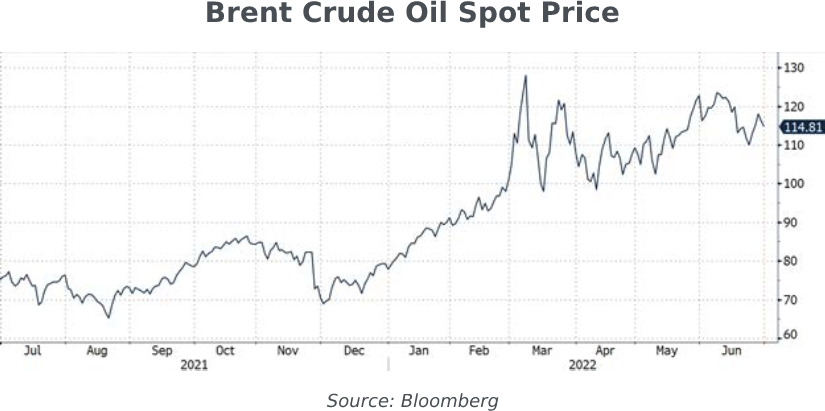
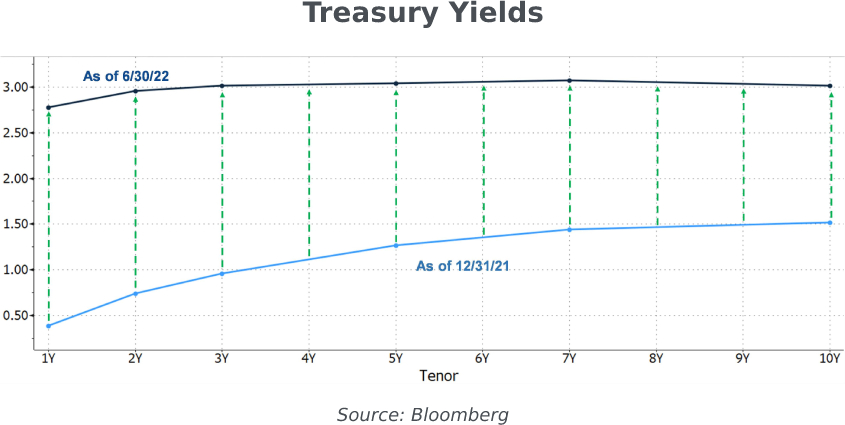
• Persistently high inflation trends have forced the Fed to rapidly shift to a far more hawkish stance –they’ve already raised the Fed Funds rate by 1.5% (while stating further hikes are anticipated). The corresponding spike in rates is weighing on asset prices in general.
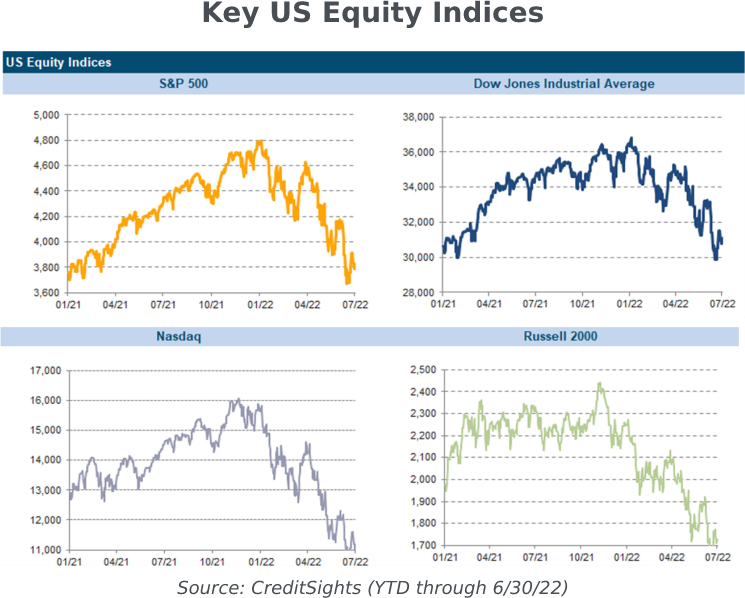
• Equities have sharply repriced to reflect the new reality: although markets have rallied off the lows, at the halfway point domestic large caps (S&P 500) are down -20%, small caps (Russell 2000) -23%, tech (Nasdaq) -29%, and the Dow Jones -14%.
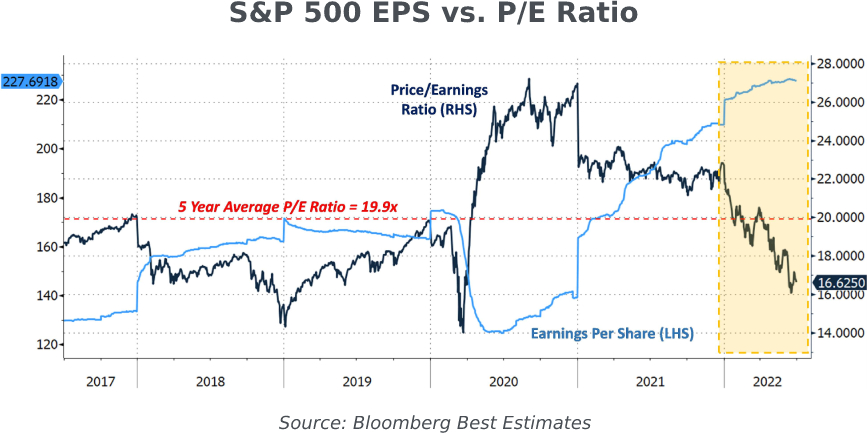
• The main culprit is multiple compression, as public EPS estimates have remained stable while P/E ratios have contracted.
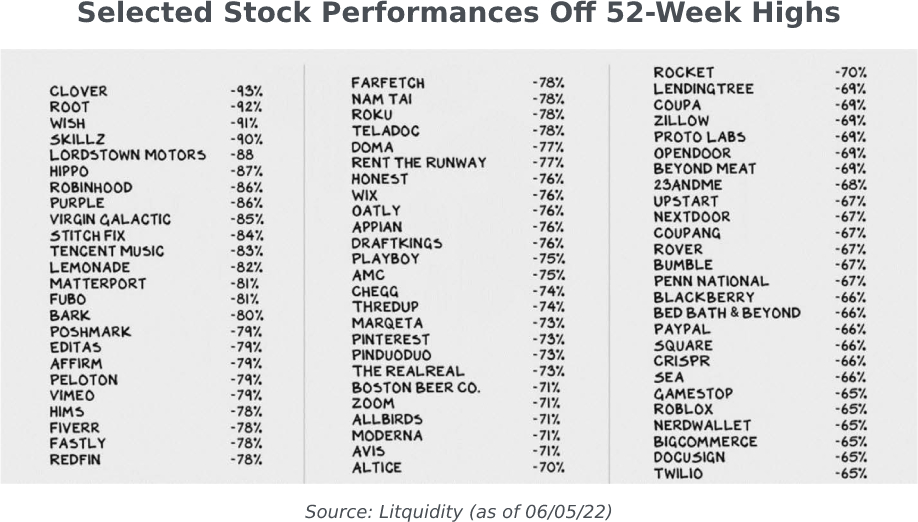
• As we anticipated last October (Alert: Fed Tapering is Coming: Avoid Zero Cash-Flow Stocks and Bonds, 10/13/21), higher rates destroyed the valuations of zero cash flow companies. It’s strikingly similar to the carnage we witnessed in the 2000-2002 bear market.
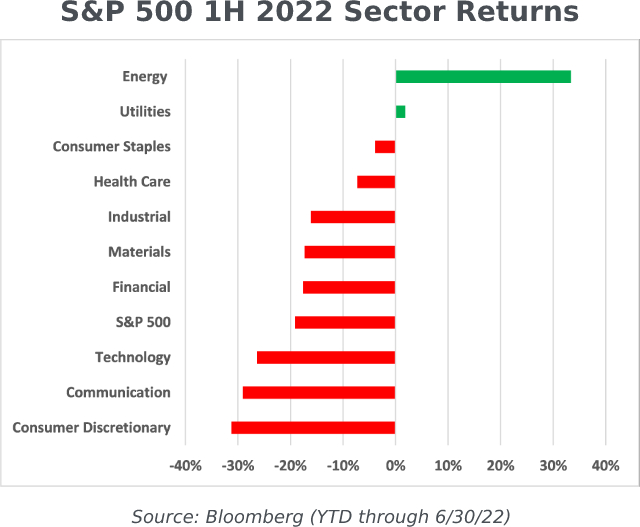
• With the shifting paradigm, Value stocks have handily outperformed Growth – the S&P 500 Value’s YTD performance is -11.3% while S&P 500 Growth is off -27.6%. Much of this is the result of surging oil prices which propelled the S&P 500 Energy index +33.4% YTD while rising rates helped sink the S&P 500 Information Technology index -26.4%. In fact, except for Energy and Utilities, every sector of the S&P 500 has posted negative returns.
• Given the unusual speed and magnitude of the spike in yields, fixed income suffered through one of the worst starts to a year since the Volcker era (when coincidentally, I still remember lining up to buy rationed gas for our family car). Most of the major global aggregate bond indices – Treasuries, US Corporates, Municipals, etc. – have spent at least part of the year down at least -10%.
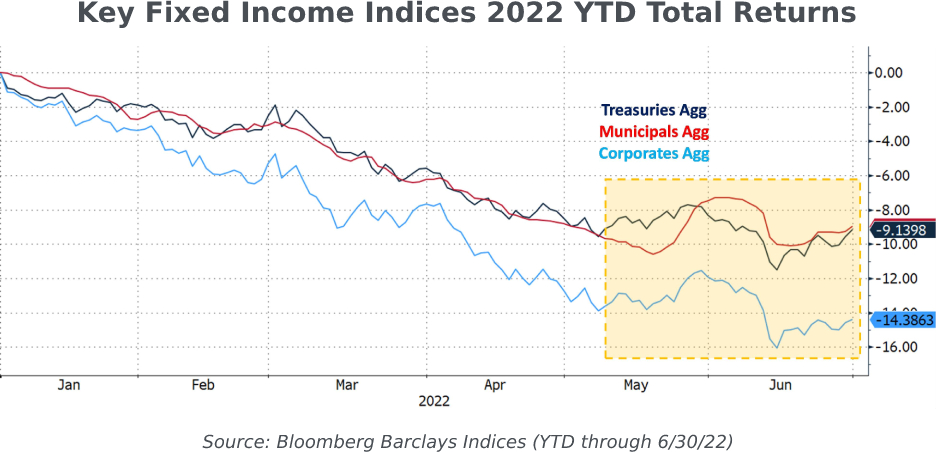
• It’s no surprise the spike in rates inflicted real damage on these relatively high-duration indices (see Alert: Fed Tapering is Coming: Avoid Zero Cash-Flow Stocks and Bonds, 10/13/21). As we’ve communicated with clients, we’ve maintained client bond durations well below benchmark levels, keeping maturities/calls reasonably short to help protect against declining prices in a rising interest rate environment.
A Strange Ride for Municipal Bonds
Due to a technical and short-lived imbalance in April and May, the municipal bond market sold off harder than comparable taxable markets, causing a spike in rates that created a brief but significant buying opportunity. The resulting blow to bond prices and fund Net Asset Values caused investors to pull money from municipal mutual funds, further exacerbating the supply/demand mismatch. The combined effects of this market volatility enabled us to add high-grade munis to client portfolios at levels approaching 140% of comparable Treasury rates, levels seen just a handful of times in the last decade.
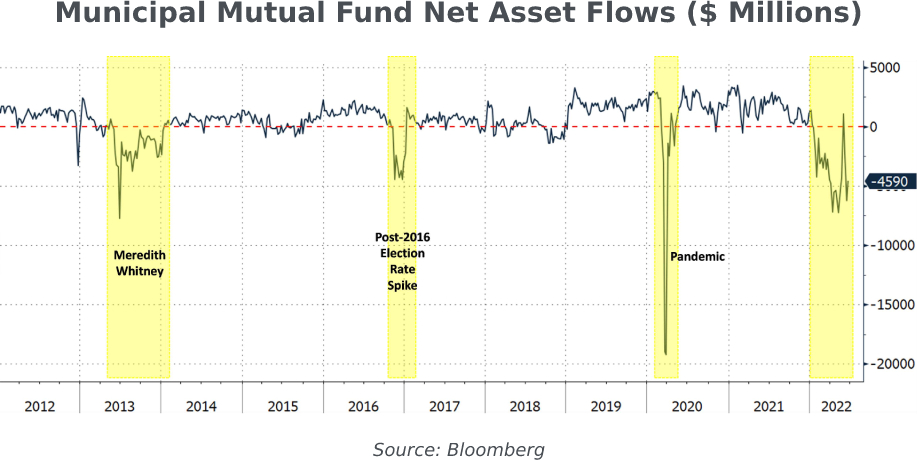
As the technical imbalance faded in mid-May, muni relative valuations reverted back down to drastically less attractive levels, causing us to pull back on our purchases.
Normalizing Will Be Painful
We’ve spent years commenting on the distortions created by global central bank policies that engineered the ultralow rate environment. For most of the past 13+ years, we haven’t had a market determined level of interest rates. The persistent near-zero yields and Quantitative Easing (“QE”) acted as a powerful tailwind that lifted virtually all asset prices.
Well, now the merrymakers at the Fed have crashed the party by not only hiking the Fed Funds rate multiple times, but also reversing the flow of money via Quantitative Tightening (“QT”, or a contracting of the Fed’s balance sheet). They will allow $47.5 billion of Treasuries and mortgage-backed securities per month to mature (or roll off its balance sheet) through August, and double that amount starting in September. The last time anything even close to this experiment occurred was back in October 2017, and you’ll recall it didn’t end well for markets.
There’s simply no playbook for what lies ahead. We remain skeptical that the Fed can pull off simultaneously normalizing its balance sheet, controlling inflation, and avoiding severe market disruptions.
The Greater the Excesses, the Harder They Fall
For years we’ve highlighted the excesses created by the rosy combination of near-zero interest rates and QE. Now with rates higher and the Fed tightening, a massive repricing of some of the most egregious extremes is underway.
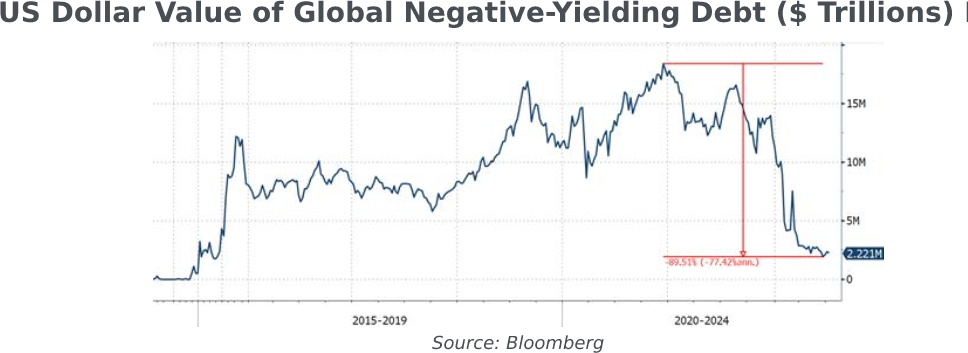
• Global negative-yielding debt peaked at $18 trillion but is now rapidly moving towards extinction (along with a good chunk of bondholders’ principal).
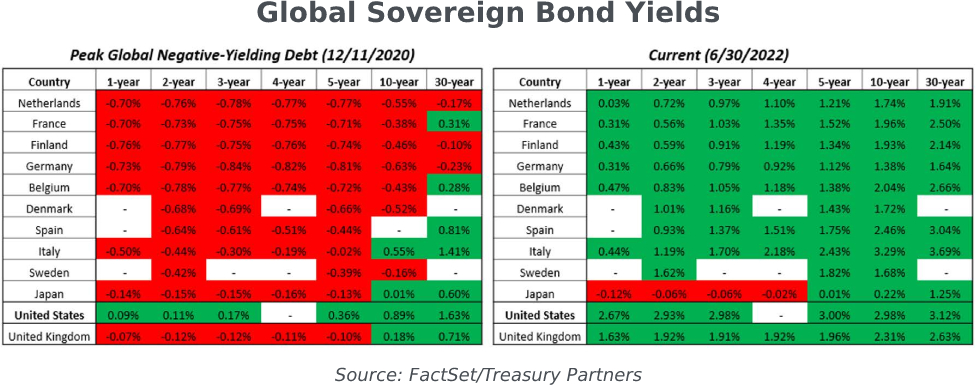
• Correspondingly, global sovereign bond yields, which spent the better part of a decade mired in a sea of negative yields, are now normalizing.
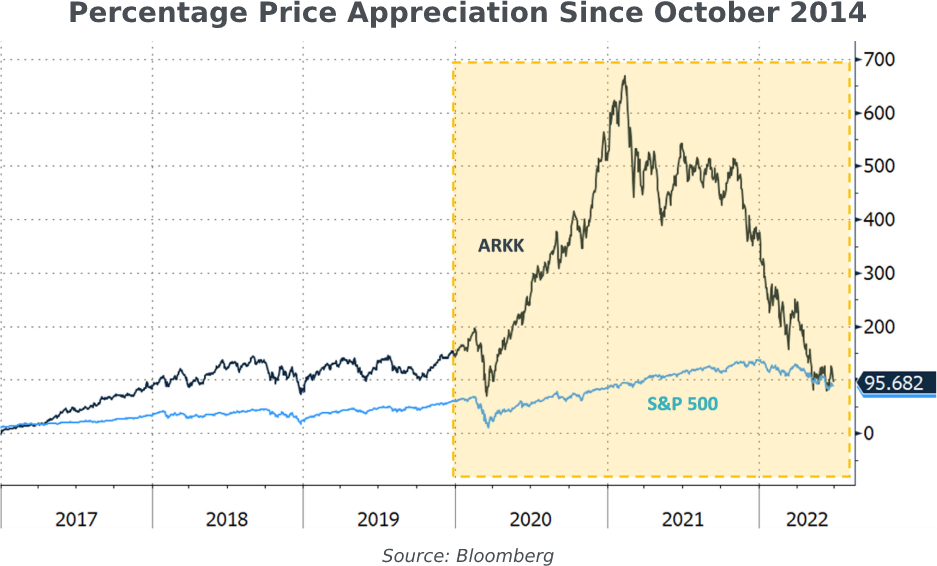
• The most speculative equities (those with untested business models and little/no current profits) tend to be growth companies, whose valuations are often based on optimistic assumptions of far-off success and monetization. The Ark Innovation ETF ($ARKK) is a striking microcosm of the shifting winds of the QE-to-QT transition.
From its late 2014 inception, ARKK’s portfolio of deep-growth equities spiked to a nearly +675% price return by early 2021, handily outperforming the S&P’s approximate +100% increase over the same time period. Since then, the outperformance gap has drastically narrowed to the point where it has given back practically all of its prior outperformance.
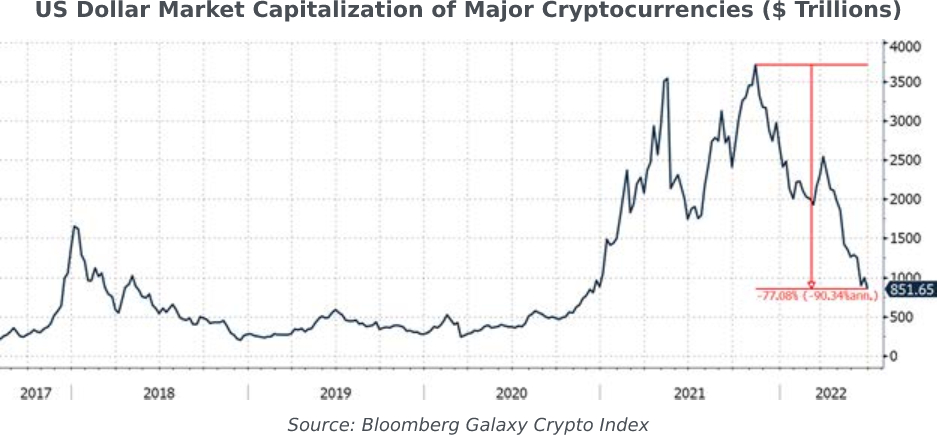
• It’s a similar story in cryptocurrencies, an ‘asset’ which still hasn’t proven it carries any intrinsic value. The aggregate market cap of the major cryptocurrencies had reached a staggering $3.7 trillion (approximately) by late 2021; their collective value has since crashed over 2/3rds, down to less than $1 trillion.
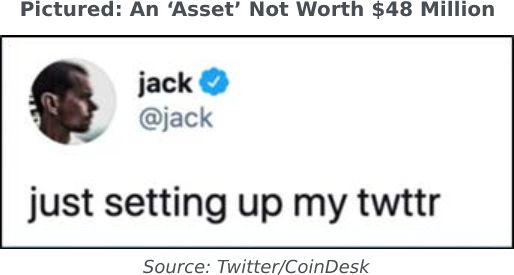
• Shockingly, the meltdowns in more niche areas such as ‘Non-Fungible Tokens’ (“NFTs”) are even worse. Consider the notorious example of the NFT representing an image of Twitter cofounder Jack Dorsey’s first-ever ‘tweet’ from March 2006:
o The NFT initially auctioned in March
2021 for >$2.9 million
o In April 2022, the initial purchaser put the NFT
up for auction, with the expectation of getting a windfall upwards of $48
million
o The highest bid came in at approximately $277.00
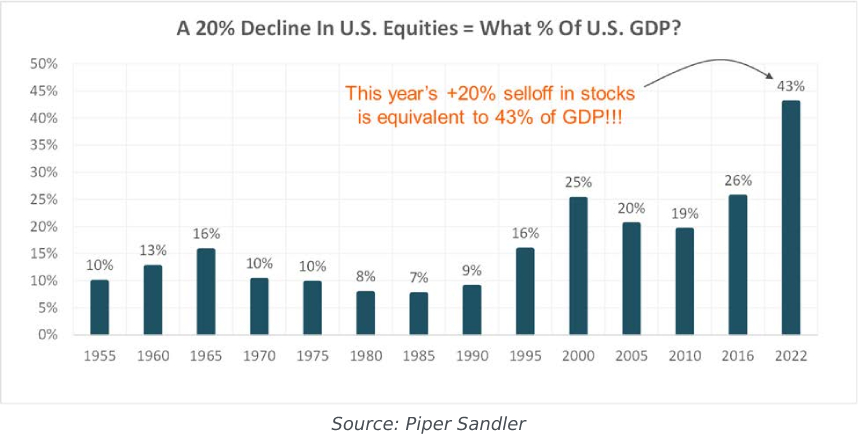
• Although the pain in more traditional risk assets hasn’t been nearly as bad, it’s still had a tremendous impact on investors’ net worth. Thanks to years of QE enabling the value of US equities to skyrocket in comparison to the size of the underlying real economy, the absolute wealth destruction from this downturn has been stunning.
Fundamentals: Cracks Starting to Form
Underlying economic conditions have begun to deteriorate, and whispers of recession risk are growing louder. To be sure, there are still good reasons to remain optimistic:
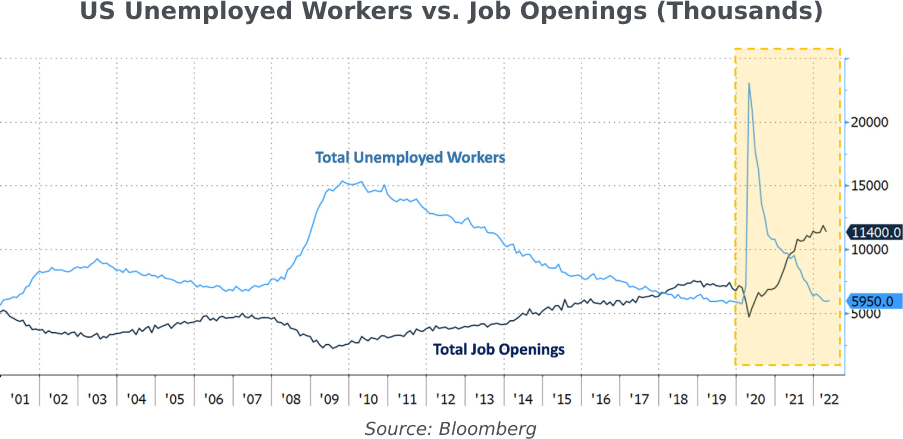
• The labor market remains at generational tights, with the number of job openings still comfortably exceeding the number of job seekers.
• Consumer balance sheets remain strong, supported by pandemic stimulus savings, increasing wages, and elevated home equity values.
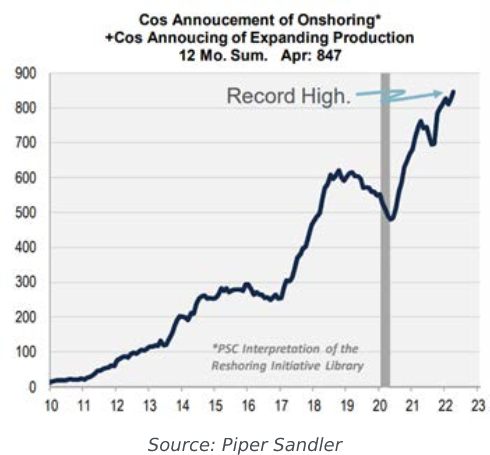
• The longer-term trend of onshoring manufacturing within American borders continues, leading to increased domestic capital expenditure investments. Sustained investments into productive assets have historically helped increase economic activity and employment.
But the headwinds are growing in both number and severity:
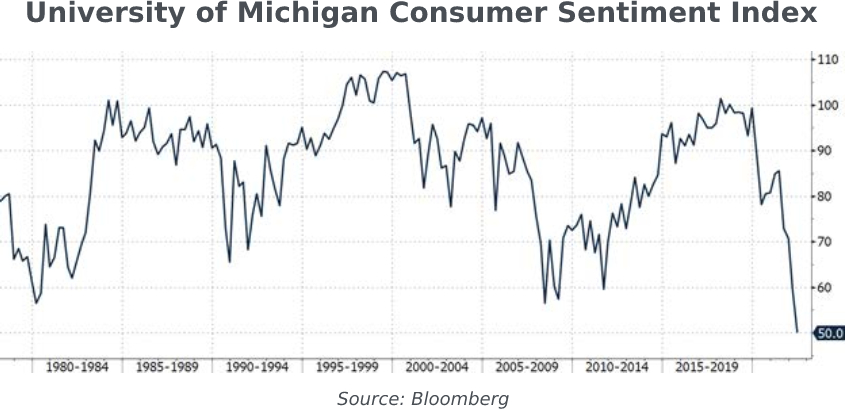
• While consumer financials may still be rosy, their mood is anything but – consumer sentiment measures are plunging to all-time lows. Such malaise could point to a slowdown in discretionary spending, particularly since the primary cause seems to be inflation angst.
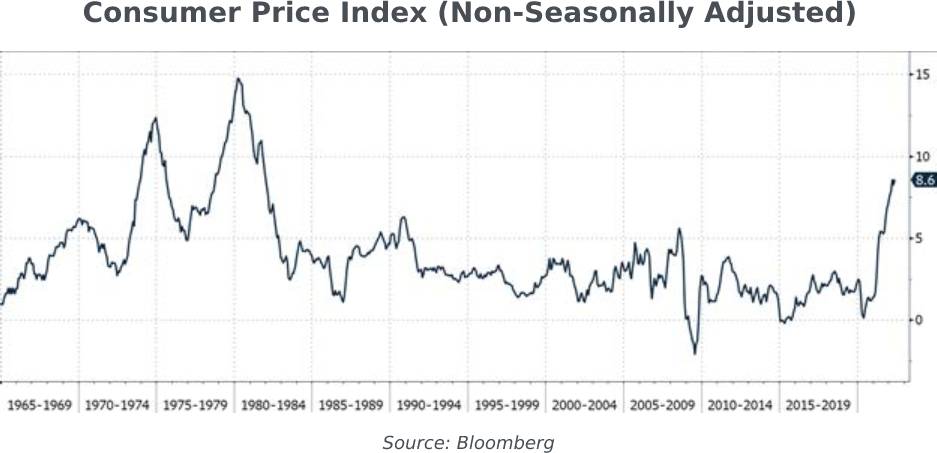
• Inflation continues to rage at levels unimaginable just a short time ago (in fact, it’s at the highest levels in the past 40+ years). Even worse, there are mounting signs that these unacceptably high rates are becoming increasingly entrenched and widespread throughout various components of the real economy.
Equities
Clearly, markets have already priced in lots of pain, enough to raise a subtle but vital question: are we now past the worst of the repricing? Where exactly is the bottom?
Valuations. As always, valuations will be determined by developments in the two most crucial determinants of prices – earnings and multiples. Right now, the S&P 500 is trading at appr. 16.5x estimated 2022 earnings of $225-$230 per share. The dynamics behind both measures couldn’t be more different:
• Multiples, which are traditionally sensitive to rising rate environments, have indeed contracted several turns from the mid-20x range at the start of 2022. But while the multiple contraction has already been significant, the fact remains that historically 16x still isn’t a particularly cheap multiple. There’s plenty of room for further decline, particularly if rates keep surging higher.
• The official $225-$230 2022 EPS consensus estimates are strong, but we consider them overoptimistic given the deteriorating macroeconomic backdrop (doubly so for official 2023 EPS estimates of $250). It’s highly likely at least some downward revisions will soon be announced.
Altogether, we see continued pressure on stocks from contracting multiples and reduced earnings.
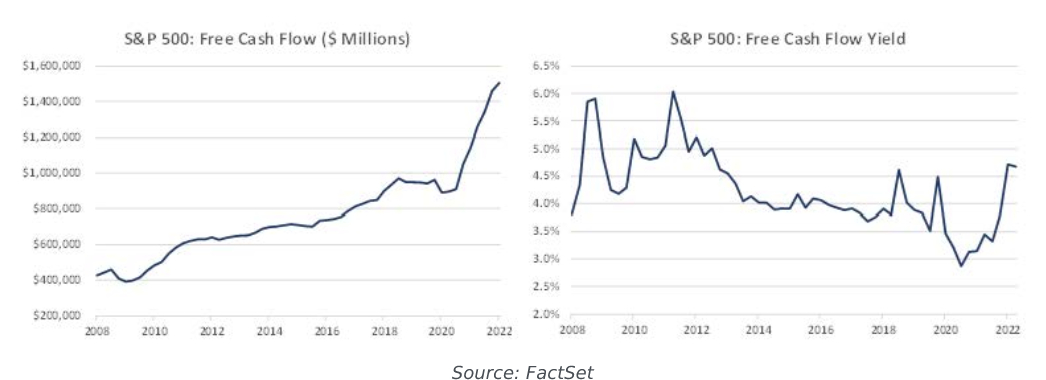
Cash Flow. As longtime readers know, we pay attention to cash flows. At the start of 2022, the free cash flow (FCF) of the S&P 500 was approximately 3.75%. After the YTD selloff, the FCF is approaching 4.75%. As a reference point, in the depths of the 2008 market sell-off, the FCF was nearly 6%. We’ll continue to monitor the markets from a cash flow perspective.
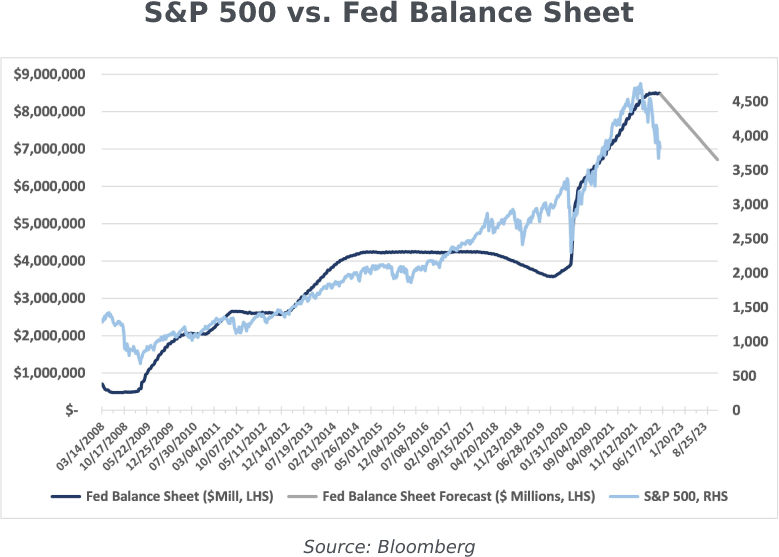
Impact of the Fed. We can’t help but observe (and worry about) the strikingly tight positive correlation between increasing amounts of QE (via an expanding Fed balance sheet) and the S&P 500. Now that the Fed has embarked on QT, will draining liquidity have the opposite impact on the market?
As I think back on several of the challenging investment climates I’ve experienced over the last 40 years, this is one with the most cross currents.
The combination of surging inflation, an aggressive Fed, commencement of QT, potential tail-risk events out of Ukraine, and upcoming midterm elections makes for an unusually volatile mix. Fast markets and frequent large swings are symptoms of ‘powder keg’ environments which warrant unusual caution.
As long-term investors, we avoid market timing; as such, the magnitudes of our equity allocation adjustments are more in-line with trimming exposure rather than wholesale derisking. We’d rather wait for some of the storm clouds to pass, even if stocks rally, before getting more aggressive. There simply are too many uncertainties right now to risk more capital than necessary.
Fixed Income
Whether we’re close to “bottoming” in fixed income wholly depends on the future path of inflation.
In the near-term the Fed certainly seems committed to taming the beast; after more than a decade of emphasizing the “maximum employment” half of its dual mandate, the highest sustained inflation readings in many Americans’ lifetimes have them laser-focused on reestablishing price stability. With jumbo-sized 50 and 75 basis point hikes already implemented and more seemingly on the horizon, the Fed-sensitive front-end of the curve (approximately 3 years and in) already reflects significant tightening.
Why, then, are long-end rates hardly any higher than short-term yields? Despite the rapid relative increase in yields, the longer end of the yield curve is jumping ahead and pricing in a slowing economy.
As we stated in Alert: The Biggest Decision Facing Bondholders Today (4/25/22): “Across the curve, rates are now testing post-GFC highs that barely qualify as pre-GFC lows. One paradigm indicates this is an attractive top, while the other warns it’s just the beginning of a secular rise in rates. Deciding on direction is the single biggest decision facing bondholders today.” The intervening months haven’t brought much additional clarity, and the challenge remains the same. We’re continuing to remain very selective, only adding longer-dated exposures when very favorable levels are available.
Our main theme is simple: we’re increasingly concerned that investors may be forced to endure more downside volatility in this tricky environment. Equity valuations continue to face pressure from both contracting multiples and falling earnings estimates as recession risks loom. Meanwhile, an aggressive Fed that’s forced to focus on reining in inflation is a very tough obstacle to overcome.
While hindsight may show that now is the period of ‘peak pain’, investment conditions are unusually murky right now. We’re being very selective in the risks we’re choosing to take on as we await more clarity. Simply put, it’s a time for defense, not offense.
We’re Moving!
As we publish this outlook, we’re just days away from moving into our new offices diagonally across the street at 300 Madison Avenue. Our growing team is excited to enjoy some much-needed extra elbow room! After we have a few weeks to settle in, we look forward to welcoming clients back for in-person meetings. While 505 Fifth Avenue’s views looking across Bryant Park will be missed, rest assured that the new views will be equally spectacular (including a top-down view of the park)!
In the meantime, we wish all of you and your families a relaxing and refreshing summer.

