


We will begin by posing a question: Why are equities at or near all-time highs after the Fed raised rates 500 basis points (5%)? The explanation goes a long way in explaining developments across markets this year.
The answer is (unsurprisingly) complex, but we think the primary factor is that despite the higher rate environment, there remains an abundance of liquidity in the system. Consider:
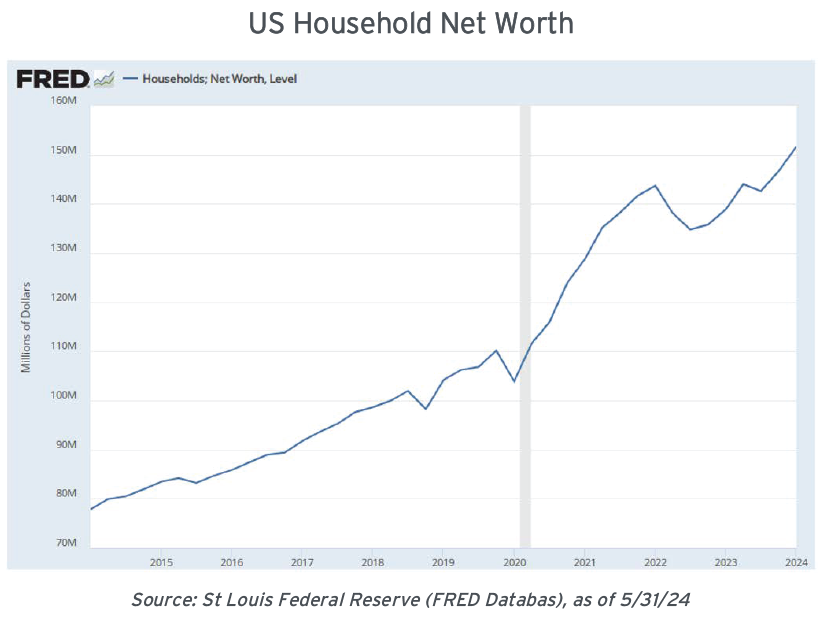
US household net worth at over $150 trillion has handily surpassed its pre-pandemic high and is steadily increasing.
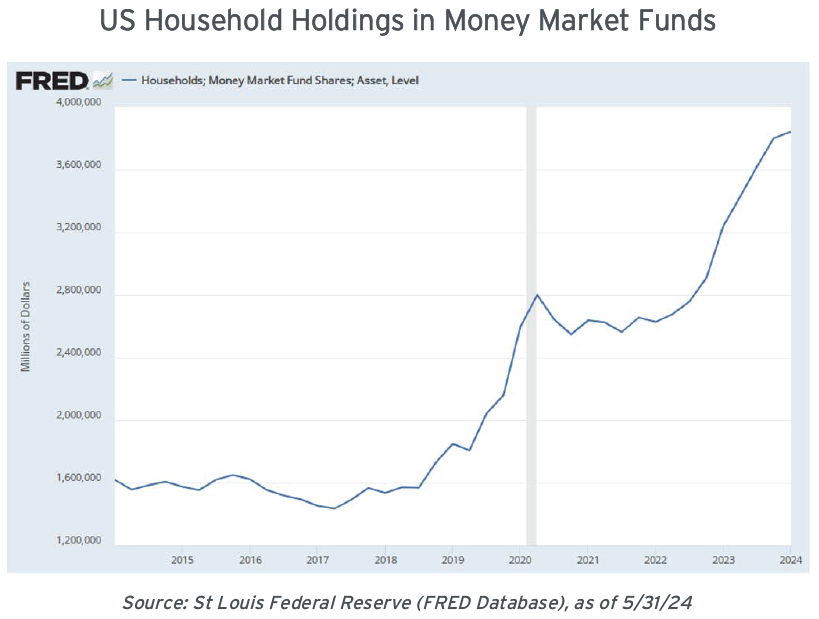
There has been a massive buildup of assets held in money market funds (MMFs), with >$6.3 trillion currently parked in MMFs (of which $3.8 trillion is owned by individual households).
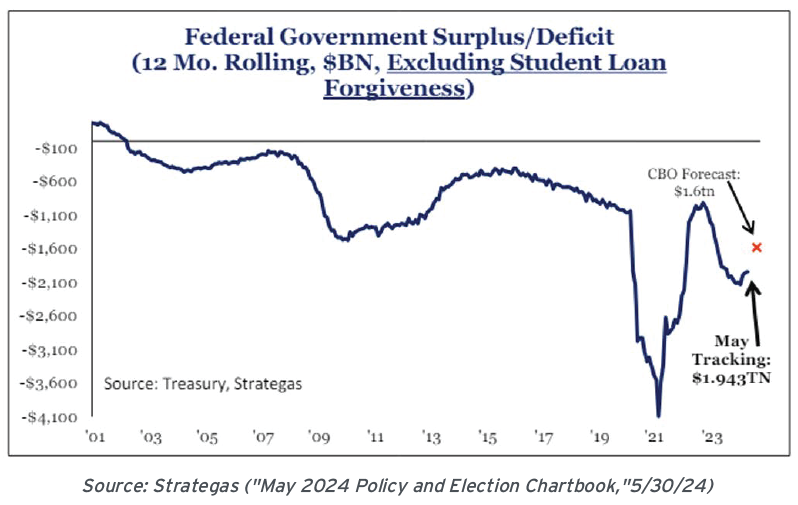
Heavily contributing to this is fiscal policy on stimulus overdrive, as Washington DC keeps running historically large peacetime deficits. The 12-month trend most recently clocked in at a nearly $2 trillion/year pace, and that's excluding the impact of any student loan forgiveness, which could add up to an additional $150 billion.
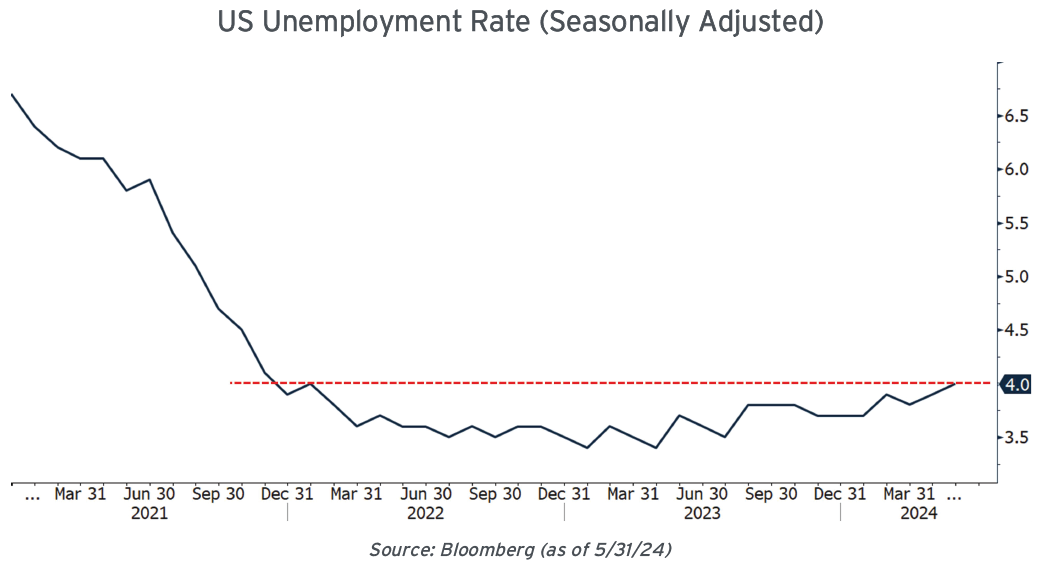
Amazingly, all this federal spending is happening despite a very low unemployment rate that's stayed at or below 4% for the past 2.5 years.
The firehose of federal spending actually ramped up at precisely the same time as the Fed was hiking, helping to partially offset the effects of monetary tightening.
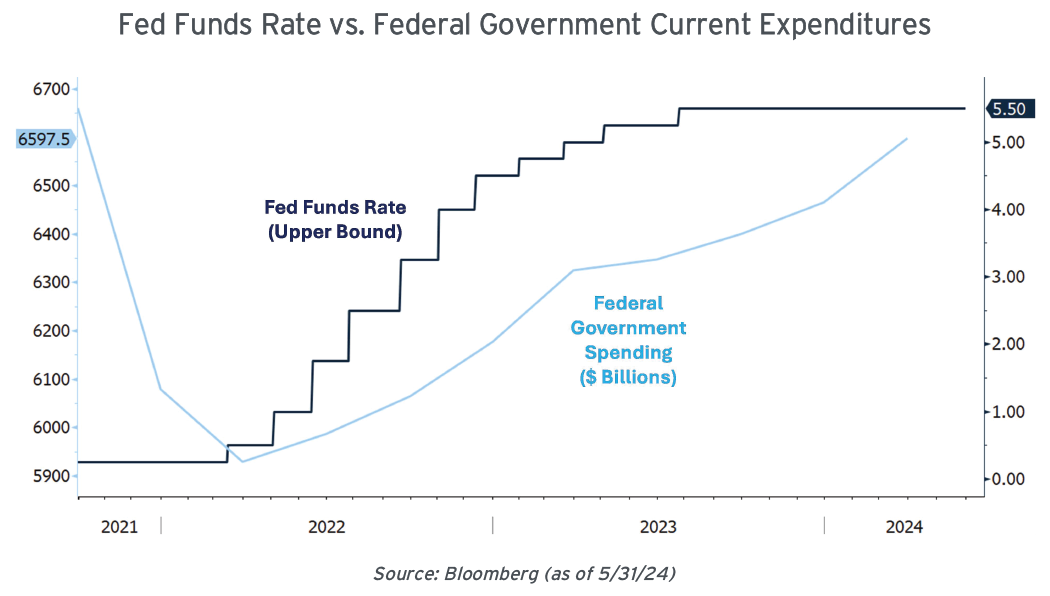
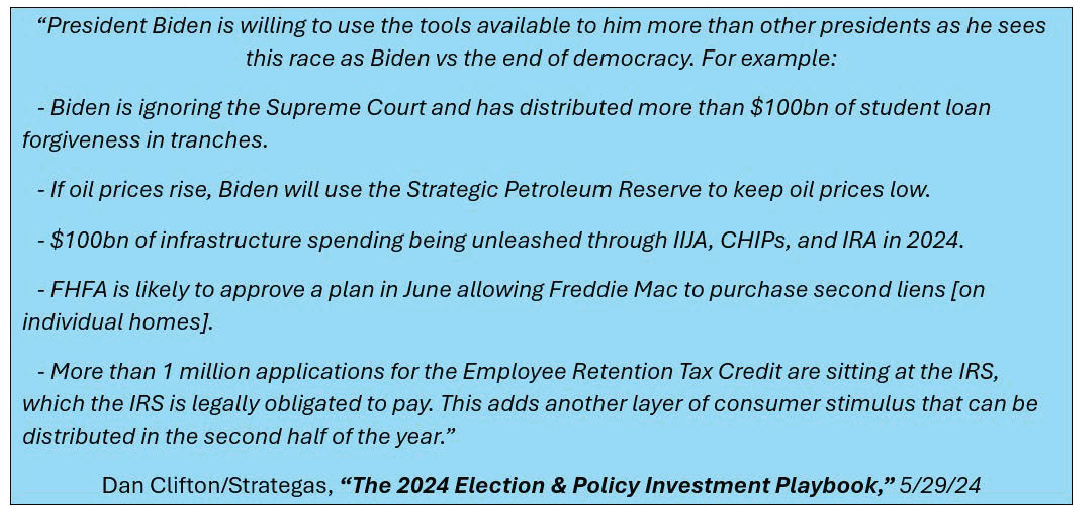
With election season in full force, we fully expect this trend of pedal-to-the-metal spending to continue unabated through at least November. As Dan Clifton of Strategas Research Partners notes:
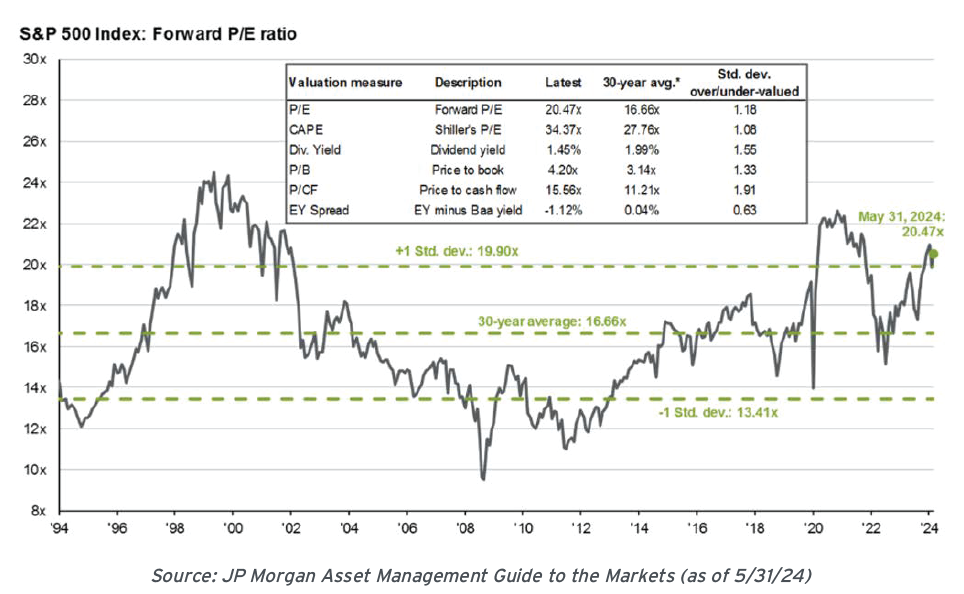
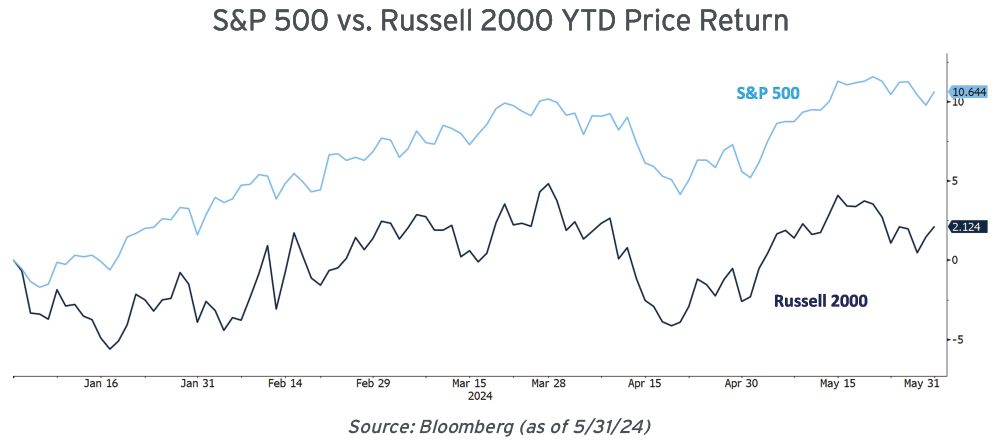
Altogether, this surplus of liquidity has been a crucial enabler allowing stocks to steadily climb higher. With the S&P 500's +10.6% YTD rally (all figures through 5/31 unless otherwise noted), its current forward P/E multiple of nearly 20.5x (>23x on a trailing-12-months basis) is comparable to ZIRP era (2009-2021) levels when interest rates were 500 bps lower. This would defy logic as stocks and bonds compete for investor capital.
But it's not just a multiple expansion story - expectations of solid increases baked into 2024 and 2025 earnings estimates have contributed heavily to this year's rally.
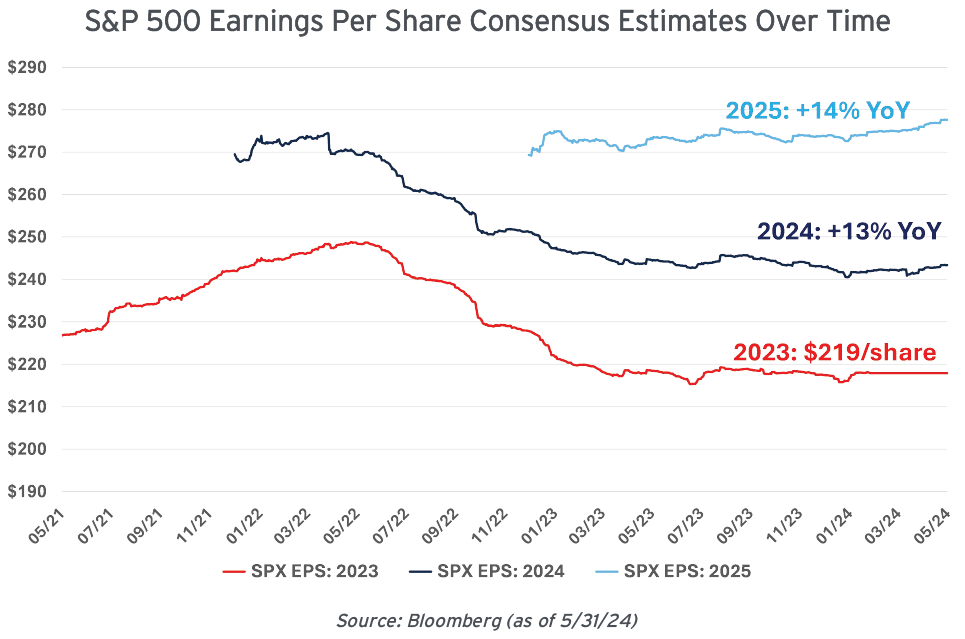
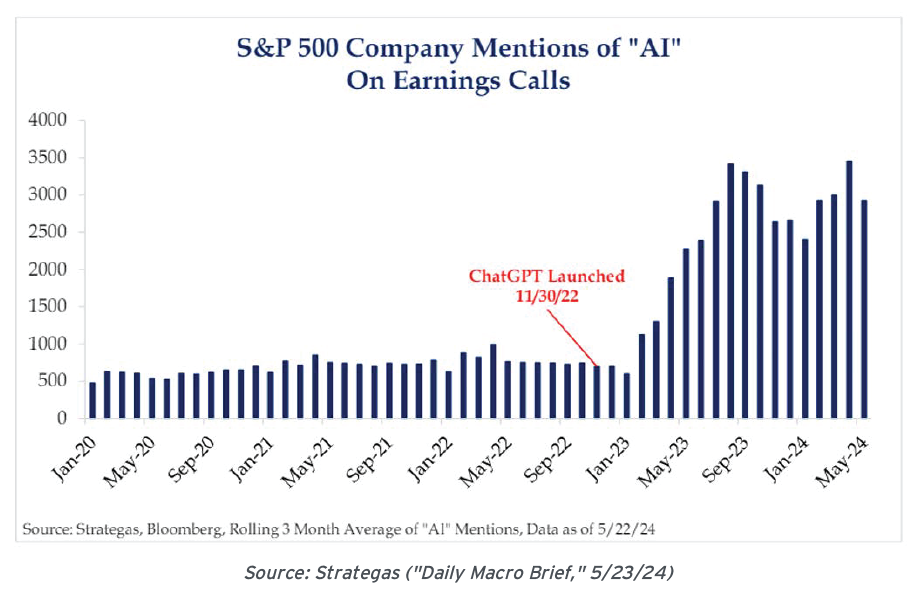
Euphoria about the potential impact of artificial intelligence (AI) is a key driver of bullish investor sentiment, with companies making sure to sprinkle AI references in earnings calls whenever feasible.
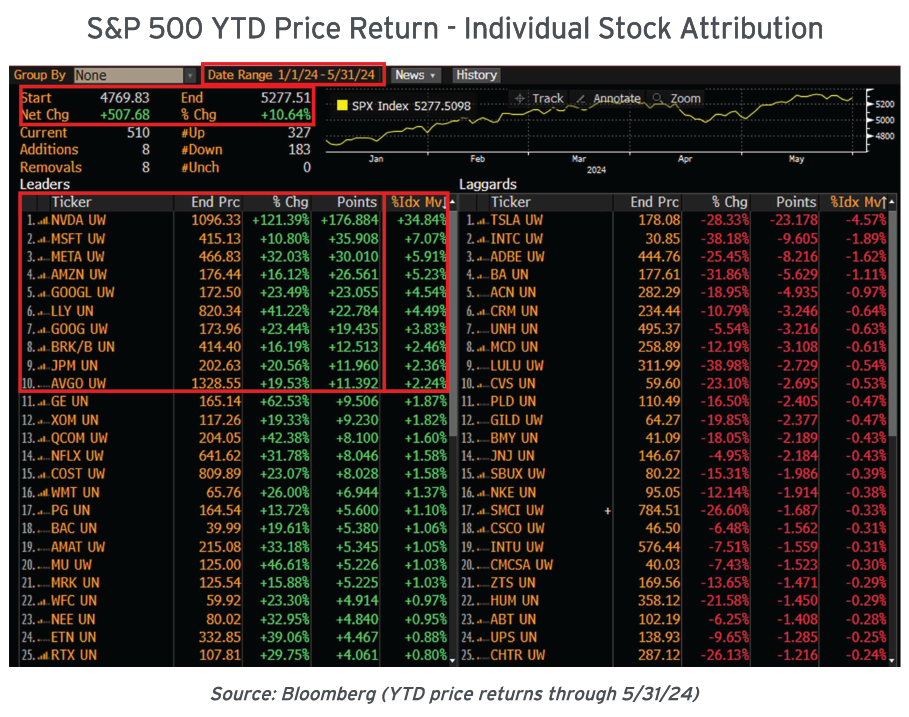
Looking under the hood, this year's returns are largely attributable to the highly concentrated 'megacap' technology sector (much more on this later). Specifically, over 50% of the S&P 500's YTD price return through 5/31 flows from just 10 individual stocks - 8 of which are in the tech sector. Indeed, a furious rally in one single stock - Nvidia (NVDA) - is responsible for over a third of the index's gain!
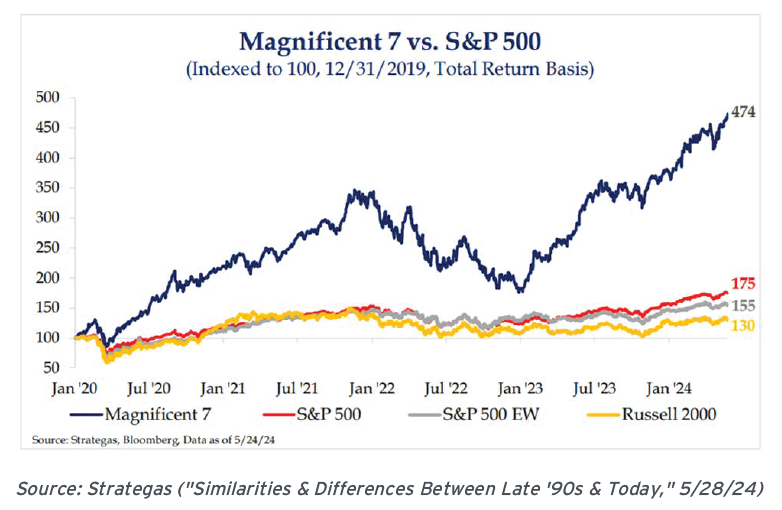
The net effect is that broadly diversified portfolios, or even those that simply are not extremely concentrated in mega-cap technology, have underperformed the index (a pattern that can now be traced back several years).
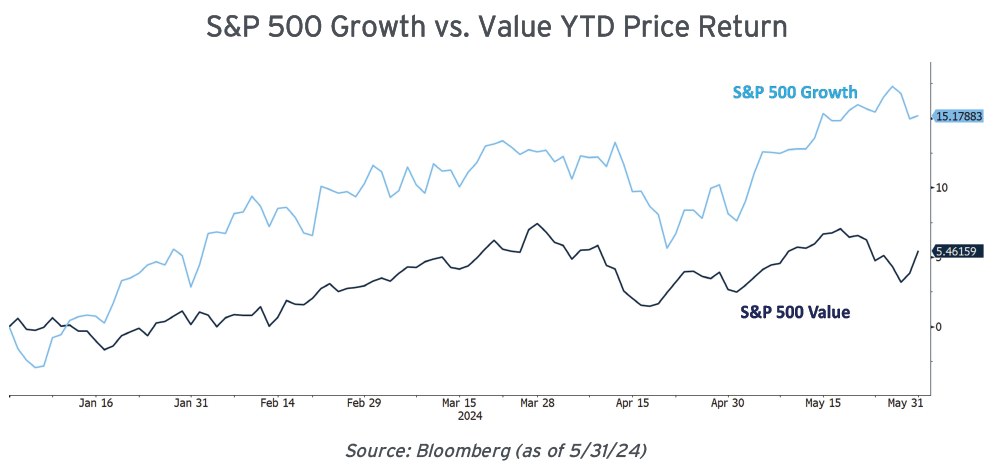
Unsurprisingly, this has resulted in the S&P 500 Growth index (+15.2%) continuing to handily outperform its Value counterpart (+5.5% YTD).
It also led to large caps easily besting the returns of small caps (Russell 2000 +2.1% YTD).
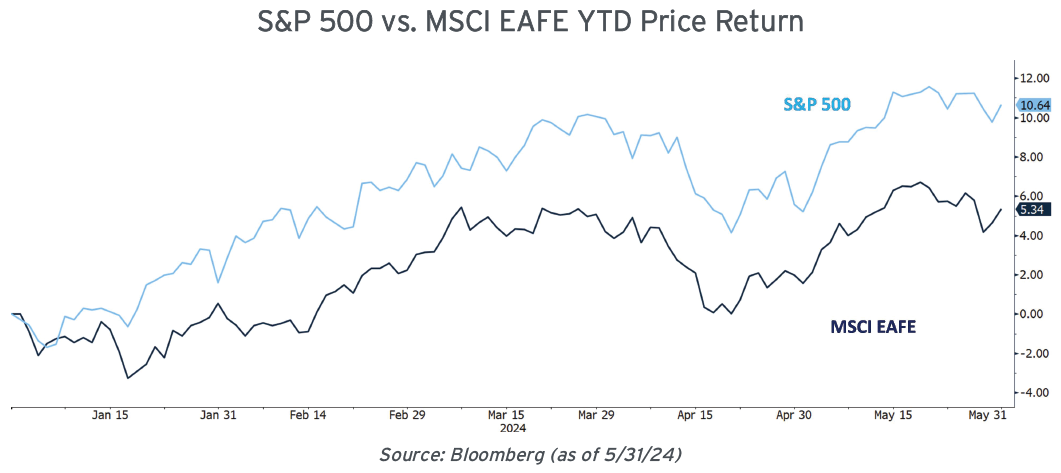
Relatedly, the tailwind from Growth is contributing to US equities once again outpacing developed international markets (MSCI EAFE +5.3% YTD). Remember that domestic markets have a much higher exposure to the technology sector than their foreign counterparts, which has proven to be a real boon for many years running.
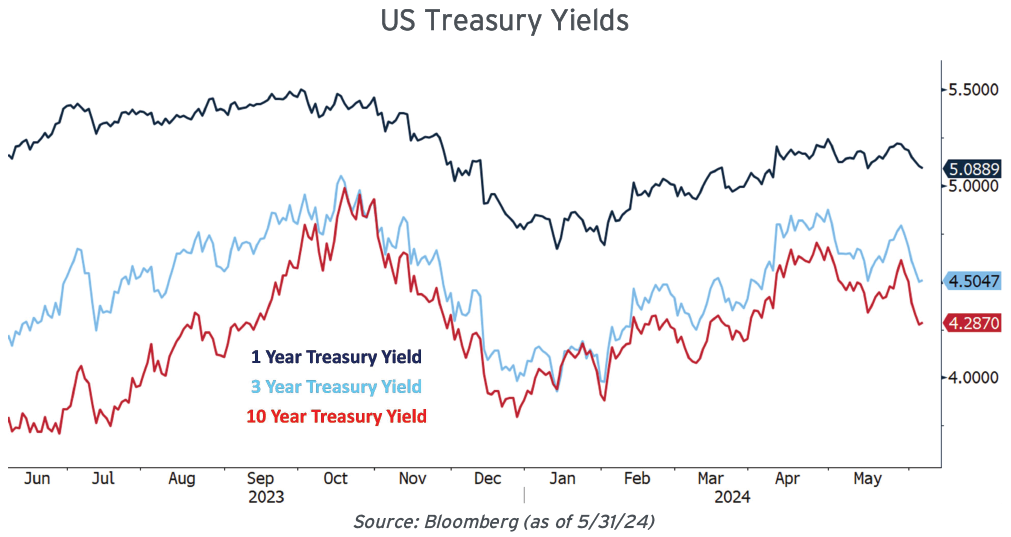
Within fixed income, the absolute level of rates remains reasonably near post-2008 highs as the market ratcheted down its expectations of Fed easing to just 1-2 cuts in the latter half of 2024. However, given the shifting Fed expectations, longer-term Treasury rates have witnessed notable volatility.
Meanwhile, Municipal/Treasury ratios have generally been mired in a low and tight trading range, albeit with 2-10 year ratios getting noticeably higher (i.e., cheaper/more attractive) in recent weeks.
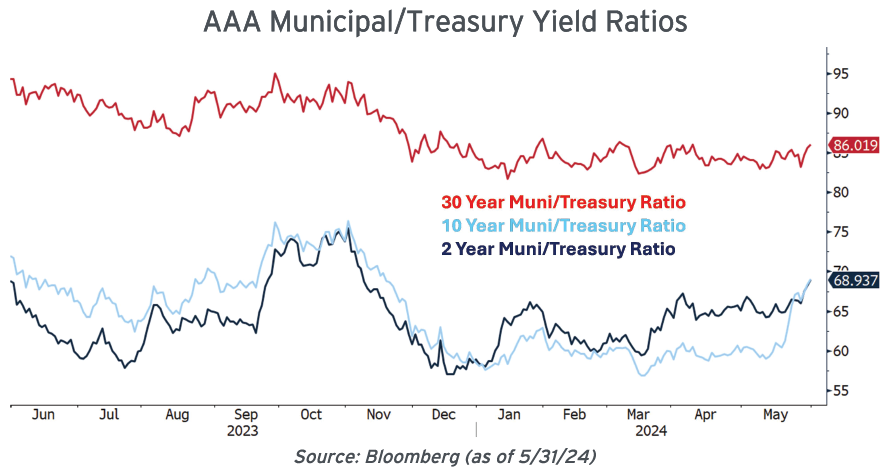
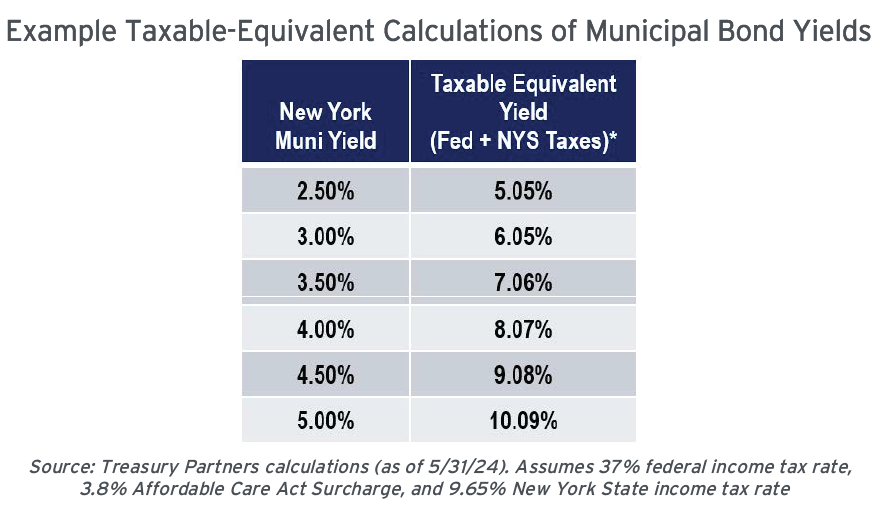
However, given the strong absolute levels of rates that are still available, the math behind taxable equivalent yields remains compelling. We have spent the first half of 2024 taking advantage of the infrequent opportunities to lock-in attractive long-term municipal bond yields.
A common thread in consensus market thinking is that cooler inflation data will ultimately lead the Fed to reduce benchmark rates, which in turn will help generally support asset valuations. But as we reach the mid-year point, it is becoming increasingly apparent that the data isn't cooperating with this benign forecast. Inflation metrics, although well off their generational highs, are clearly hitting resistance above the Fed's 2% annual target rate.
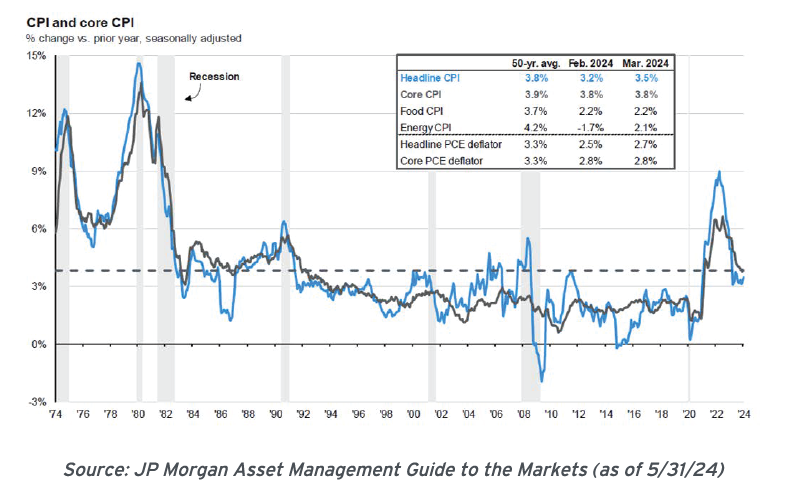
If anything, the path ahead seems to be getting harder: the 6-month annualized rate of Core CPI (a timelier representation of current trends than the YoY measure) has begun inflecting higher, and now sits close to 4%.
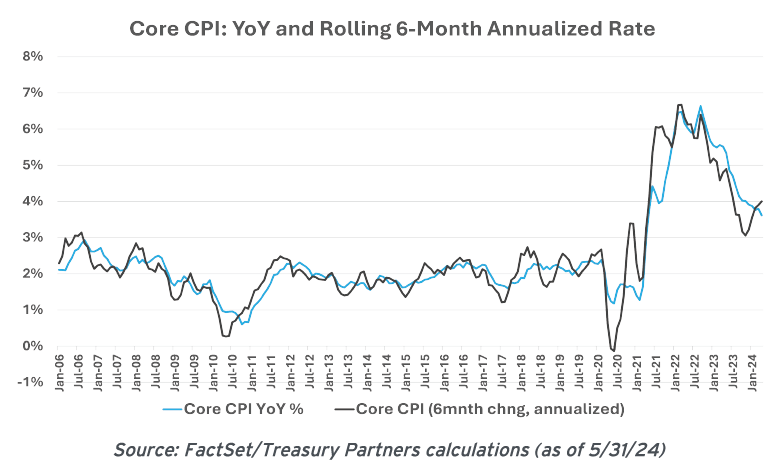
This does not come as a surprise to us, as we've long assumed the disinflationary process would become rougher once the low-hanging fruit had been picked.
But it's important to realize that there's a feedback loop at work here – inflation is proving stubborn in large part because the real economy has proven surprisingly resilient, and robust consumption (fueled by the excess liquidity we illustrated earlier) is helping keep prices buoyed.
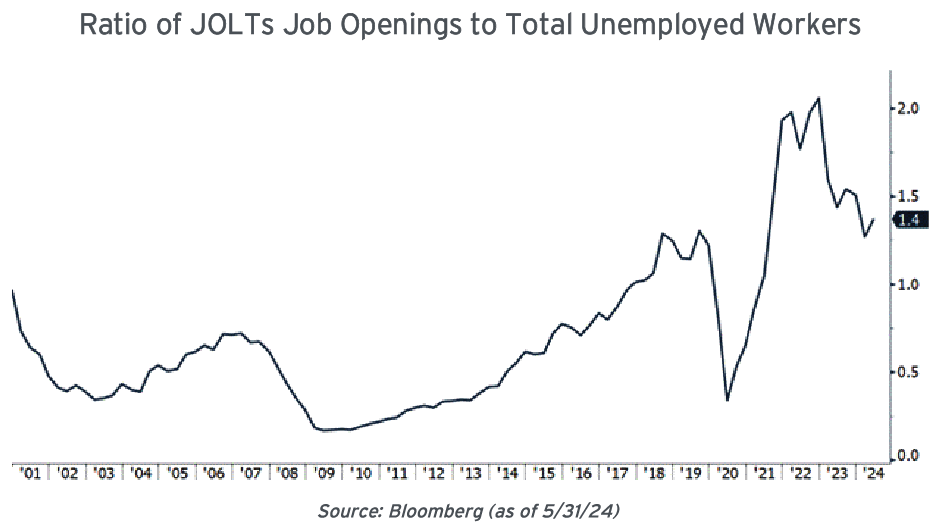
The ratio of job openings to unemployed workers is off its post-pandemic high, but by any objective measure it does appear that jobs are still quite plentiful. This matters because spending is usually highly correlated to employment (it's common sense: people who have jobs can spend more confidently than those who don't).
"If you travel 1,000 miles to go fishing, the most important aspect is the last 30 feet where you're presenting the fly to the fish… Inflation has come down, yet the final stage in moving it towards [the Fed's] anticipated goal of 2% is not occurring."
Richard Saperstein
"Inflation Surprise Rattles Markets"
The Wall Street Journal, 4/10/24
Relatedly, consumer spending - the engine of the US economy - shows little sign of slowing. However, note that we are beginning to see emerging hints that lower-end shoppers are beginning to falter.
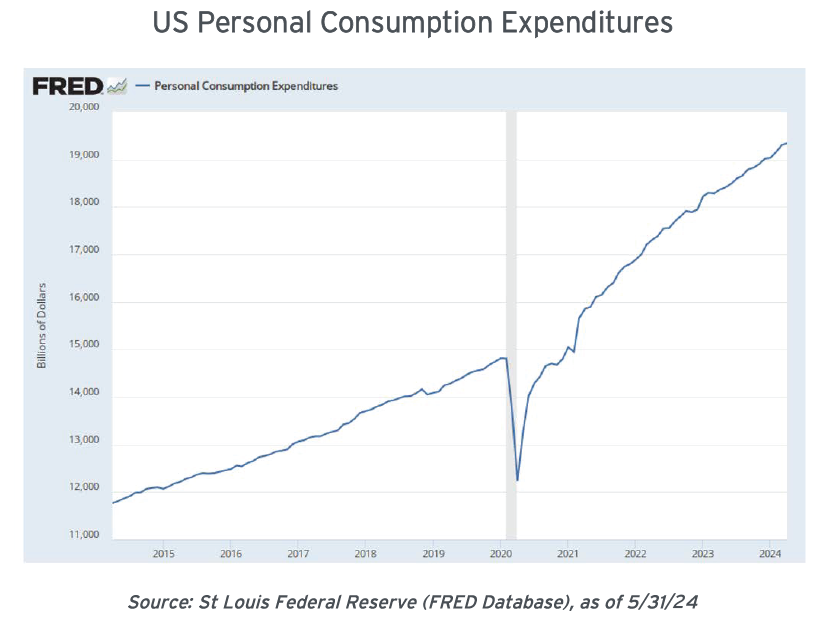
Consumer balance sheets as a whole remain healthy. In addition to the record high household MMF balances, household debt service costs are still quite manageable, running consistently below the post-2008 average of 10.2% of disposable personal income.
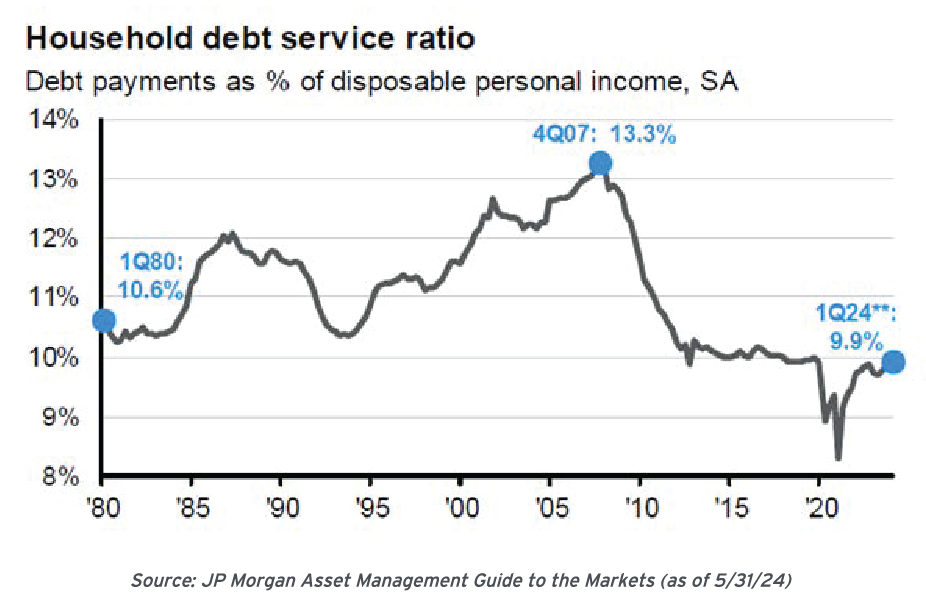
In summary, we think the mutually supportive pillars of low unemployment and strong household balance sheets are helping prop up aggregate consumption, which in turn should keep acting as a formidable headwind against further progress towards the Fed's 2% inflation target.
Despite this benign economic backdrop and the already-decent YTD returns highlighted earlier, all is not copacetic within equity markets. There are mounting signs of excessive complacency in valuations, not to mention increasingly frequent examples of speculative froth (the popularity of zero-day options, 'Roaring Kitty' and the return of 'meme' stocks, etc.).
To be clear, this is not isolated within equities: more and more, it seems risk assets in general are already pricing in 'Goldilocks' outcomes for years to come (with perhaps the only major exception being commercial real estate). Clearly, the enormous piles of cash sloshing around the financial system are being deployed far, wide, and aggressively in search of excess returns, despite the higher rate environment.
One dynamic we are closely monitoring is the evolving relationship of this cycle's longstanding 'winner-take-all' stars: the 'Magnificent 7' plus a handful of others vs. the S&P 500's other 490 companies. The dominance of these mega-cap stocks has been so thorough and massive that the top 10 stocks in the S&P 500 now constitute one-third of the index. While that is not necessarily concerning by itself, what does catch our eye is the fact that their combined weight now far outstrips their proportionate share of the index's earnings. Stated more plainly, their multiples keep expanding relative to both their own earnings and the valuations of the other 490 index constituents.
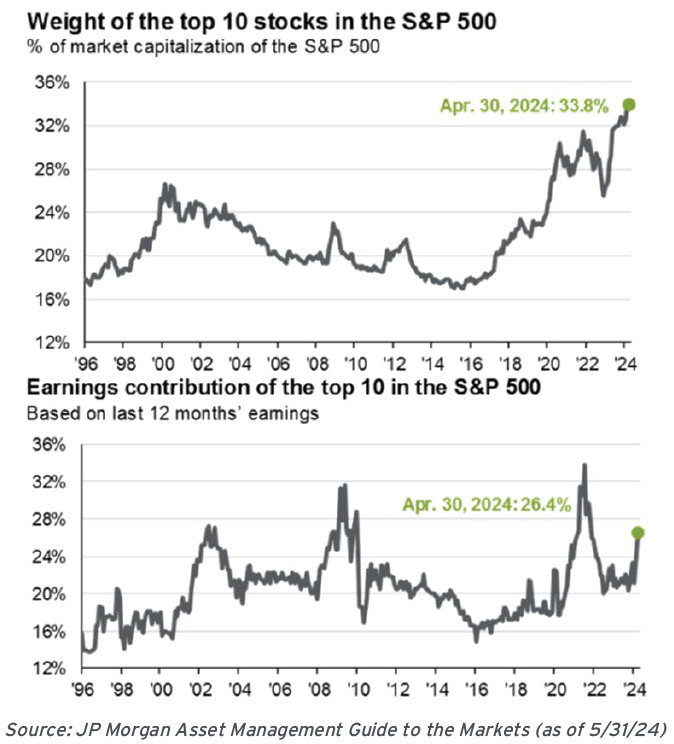
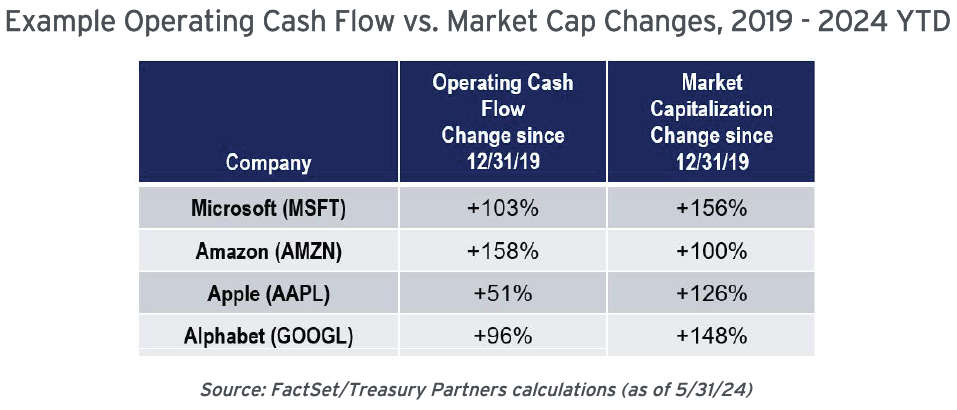
However, the mega-caps' fundamental performance is still nothing short of spectacular. It is important to remember that they've succeeded in maintaining strong operating cash flow growth that would be considered impressive for companies of any size, much less some of the largest enterprises on Earth. When considering the ongoing persistence of the advantages that helped them reach this point - i.e., their self-reinforcing network effects - it becomes increasingly difficult to bet against their continued dominance within their respective fields.
Moreover, although large-cap equity valuations are certainly high, it is important to note that they're nowhere near the multiples witnessed back in the leadup to 2000's Tech Bubble crash. On the topic of 2000-era comparisons, an encouraging point for the sustainability of today's markets is that the current market leaders are highly profitable (and actually growing in profitability), while back then the highest-flying companies were unprofitable 'moonshots' being valued only on (ultimately unfulfilled) hopes and dreams.
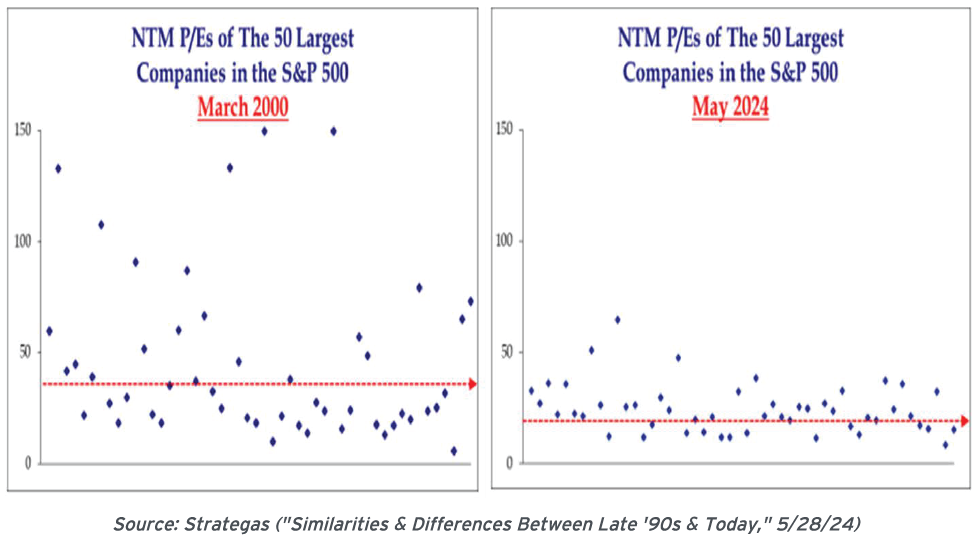
Altogether, we are maintaining the current equity market allocations within client accounts. While we are continuing our overweight by adding to the mega-cap technology sector, we've been gradually scaling back positions in small and mid-caps (SMIDs). The rationale underlying this adjustment is simple: SMIDs have consistently underperformed large caps for most of the past several quarters, and although they are 'cheap' on a relative basis, there's not much reason to expect this trend will improve until we're closer to the point when the Fed is ready to begin cutting rates (historically a harbinger of SMID outperformance in past cycles).
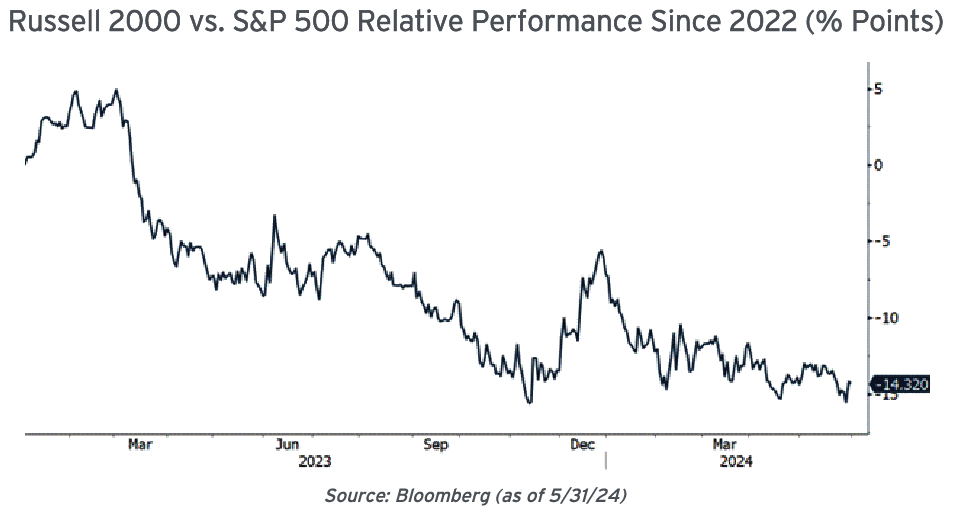
At the same time, we are also diligently reviewing clients' asset allocations, making sure the extended stock market rally hasn't caused aggregate equity exposures to grow disproportionately large. When necessary, we have pruned to bring total allocations back into their intended balance (in accordance with each client's individually tailored risk profile). As we enter a potentially turbulent Presidential election season, now is not a time to allow for sloppiness with allocation drift.
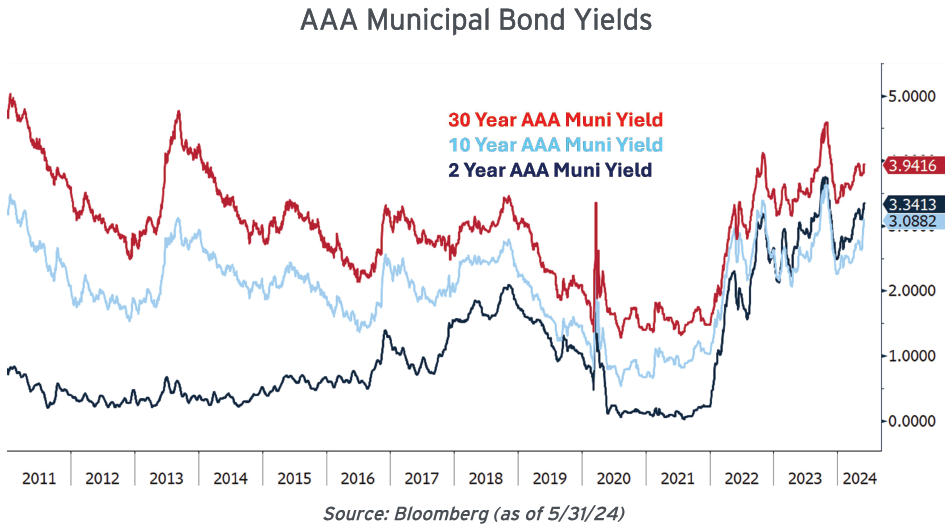
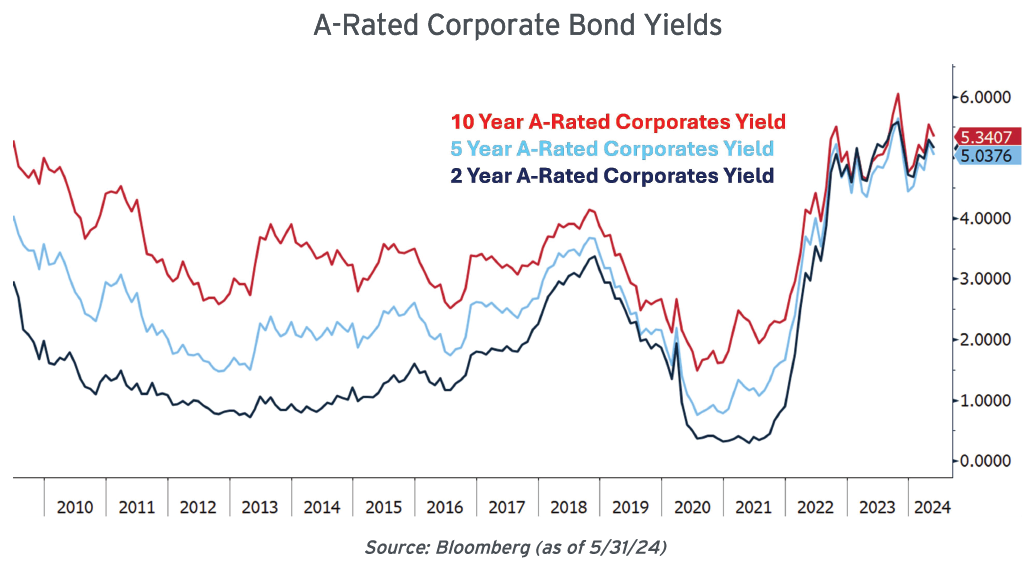
Although rates are somewhat off their highs of the cycle, the income returns available in fixed income still offer a legitimate alternative to more volatile risk assets. Looking at both the municipal and investment grade corporate markets, it certainly looks like the window to add bonds at yields that we have rarely seen in the past 10 years remains open.
An easing Fed is the biggest downside risk for rates, and the case for near-term rate cuts seems flimsy. We simply are not seeing the kind of data that justifies the need to substantively ease monetary conditions (not least because fiscal policy is still extraordinarily supportive). Accordingly, we think the current market's assumption of approximately two rate cuts by year-end feels about right, with the risks skewed more towards no cuts at all in 2024.
Naturally, we are now at the point in the cycle where there's significant uncertainty with what will happen to rates, and incoming data can cause major near-term swings. However, we are still mindful that higher yields are still a distinct possibility in the coming years due to the huge financing requirements of the Federal government's massive budget deficits. Given this outlook, why not wait for rates to increase once more before committing to new bond purchases? Simply put, although it is not our base case, we recognize that at some point, the bite of Fed rate hikes could slow economic conditions and instead lead to lower rates - a countervailing possibility that can't be easily dismissed.
Where appropriate we are still extending maturities, continuing to add 4%+ tax-exempt municipal yields on those occasions where they're available. In other instances, we are selectively adding positions in shorter parts of the curve as market fluctuations offer brief opportunities to capture unusual value: 3-4 year municipals in the 3.25%+ range, 2-7 year corporates in the 4.75-5.25% range, etc.
For portfolios with significant liquidity, we are also committing a portion of those funds into rolling 2-6 month Treasury bills ladders. The curve is inverted, and this captures the elevated yields available in that segment (as well as state and local tax-free income for those clients in applicable locations). As regular maturities roll off the short-term ladder, dry powder will become available should more attractive long-term yields come around once more.
As always, we're grateful and honored by our clients' continued trust and confidence. We hope everyone has a relaxing and healthy summer. Please feel free to reach out to us with any questions or comments.

